Earlier this week Matthew Schinckel wrote a post about how he monitors Celery queue sizes with a Redis backend.
RabbitMQ is also a popular backend for Celery, and it took us a long time to get good visibility into our task queues and backlogs. So we'd like to share our solution for monitoring RabbitMQ celery queues for others that might be in a similar situation.
Do read Matts post first. I'm going to assume you've done that, and just talk about how this script is different.
The trick to getting queue length details is to run the script from the RabbitMQ host itself, where rabbitmqctl is installed and allowed to speak to the cluster. We do this with Cron.
First, get the distinct virtual hosts in your cluster. You might just have one, but we have several.
VHOSTS=$(/usr/sbin/rabbitmqctl list_vhosts -q | grep -v "/" | xargs -n1 | sort -u)Next, define the stats to fetch from RabbitMQ:
STATS2READ=( messages_ready messages_unacknowledged consumers )Finally, loop over the virtual hosts and statistics, and push the metrics to Cloudwatch (or send them to New Relic!):
for VHOST in ${VHOSTS[@]}; do
for STATISTIC in ${STATS2READ[@]}; do
MDATA=''
while read -r VALUE QUEUE ; do
MDATA+="MetricName=$STATISTIC,Value=$VALUE,Unit=Count,Dimensions=[{Name=Queue,Value=$QUEUE},{Name=InstanceId,Value=$EC2ID},{Name=VHost,Value=$VHOST}] "
done < <(/usr/sbin/rabbitmqctl list_queues -p "$VHOST" "$STATISTIC" name | grep -Ev "pidbox|celeryev|Listing|done")
/usr/local/bin/aws cloudwatch put-metric-data --endpoint-url $ENDPOINT --namespace $NS --region ap-southeast-2 --metric-data $MDATA
done
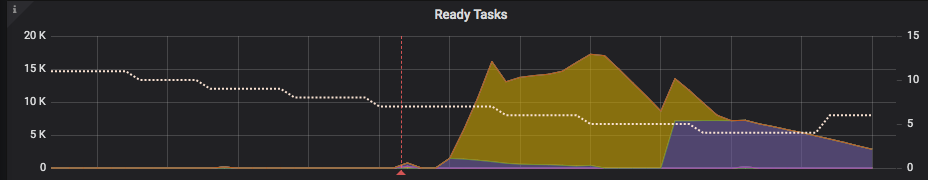
doneUse Grafana to visualise the metrics from CloudWatch, and get pretty graphs!